Geographic Visualization
We can use Env-geographic for both finished experiments and running experiments. For finished experiments, the local mode is enabled for users to view experimental data in order to help users to make subsequent decisions. If a running experiment is selected, the real-time mode will be launched by default, it is used to view real-time experimental data and judge the effectiveness of the model. You can also freely change to local mode for the finished epoch under real-time mode.
Dependency
Env-geographic’s startup depends on docker. Therefore, users need to install docker on the machine and ensure that it can run normally. User could get docker through Docker installation.
How to Use?
Env-geographic has 3 parts: front-end, back-end and database. Users need 2 steps to start this tool:
Start the database and choose an experiment to be displayed.
Start the front-end and back-end service with specified experiment name.
Start database
Firstly, user need to start the local database with command:
maro inspector geo --start database
After the command is executed successfully, user could view the local data with localhost:9000 by default. If the default port is occupied, user could obtain the access port of each container through the following command:
docker container ls
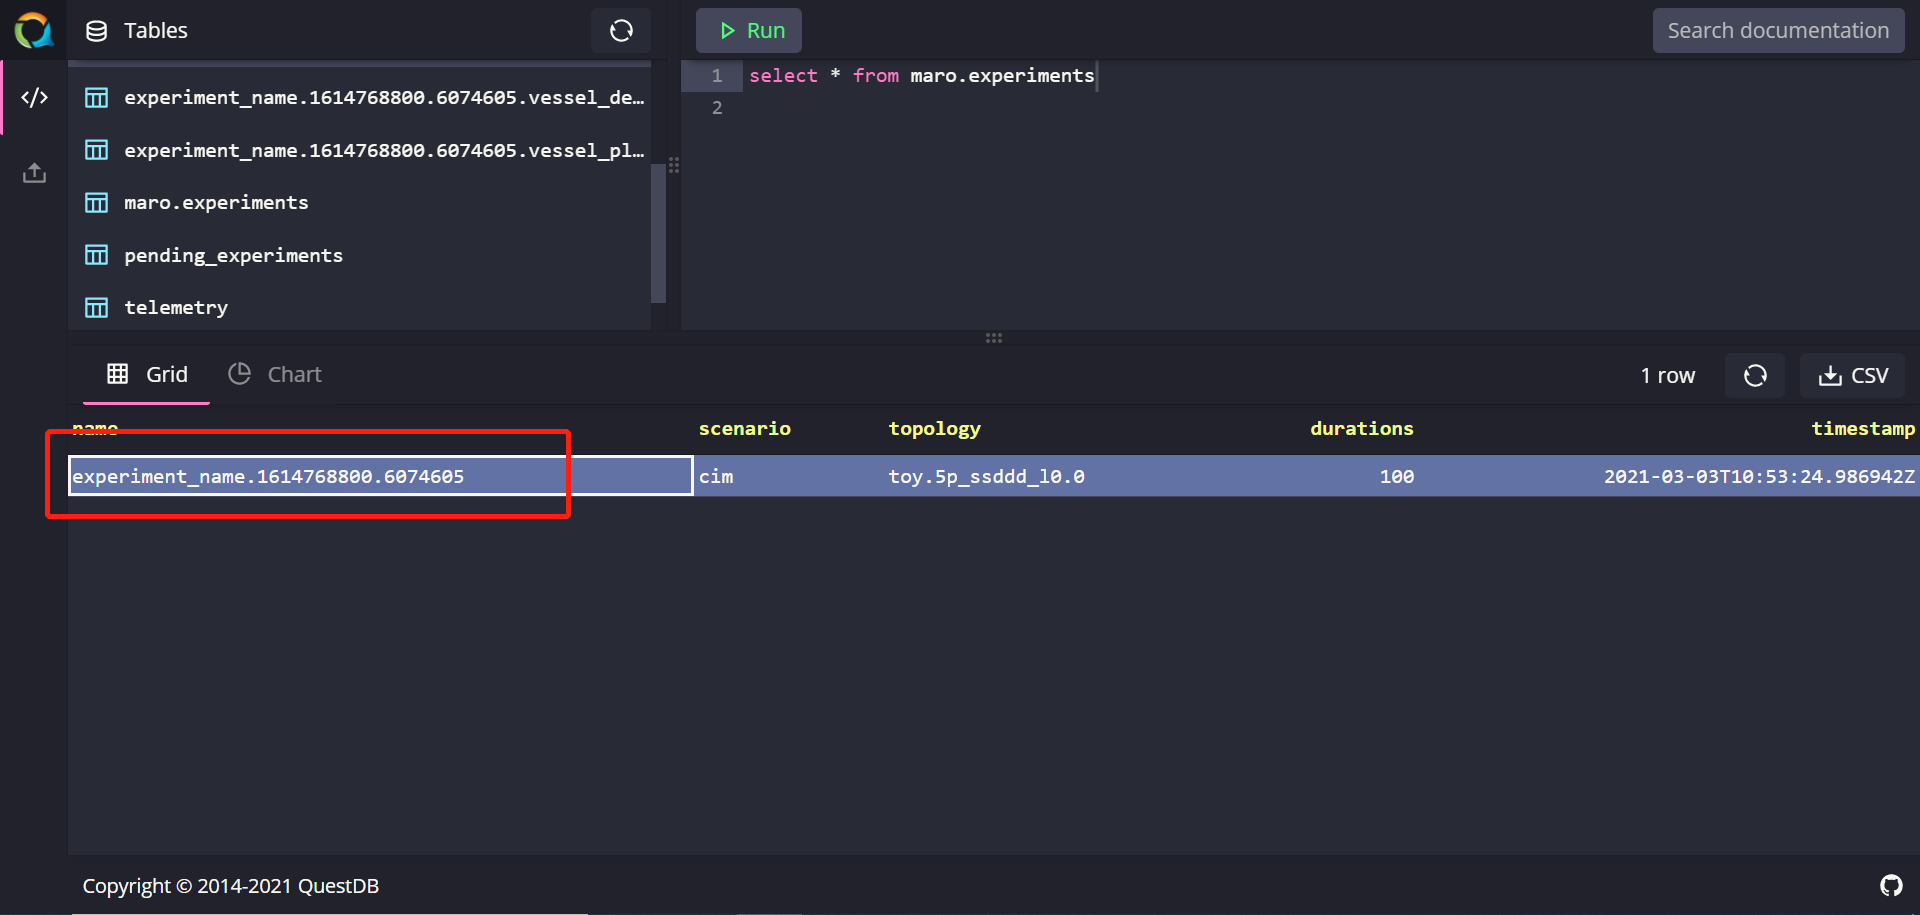
User could view all experiment information by SQL statement:
SELECT * FROM maro.experiments
Data is stored locally at the folder maro/maro/streamit/server/data.
Choose an existing experiment
To view the visualization of experimental data, user need to specify the name of experiment. User could choose an existing experiment or start an experiment either.
User could select a name from local database.
Create a new experiment
Currently, users need to manually start the experiment to obtain the data required by the service.
To send data to database, there are 2 compulsory steps:
Set the environmental variable to enable data transmission.
Import relevant package and modify the code of environmental initialization to send data.
User needs to set the value of the environment variable “MARO_STREAMIT_ENABLED” to “true”. If user wants to specify the experiment name, set the environment variable “MARO_STREAMIT_EXPERIMENT_NAME”. If user does not set this value, a unique experiment name would be processed automatically. User could check the experiment name through database. It should be noted that when selecting a topology, user must select a topology with specific geographic information. The experimental data obtained by using topology files without geographic information cannot be used in the Env-geographic tool.
User could set the environmental variable as following example:
os.environ["MARO_STREAMIT_ENABLED"] = "true"

os.environ["MARO_STREAMIT_EXPERIMENT_NAME"] = "my_maro_experiment"
To send the experimental data by episode while the experiment is running, user needs to import the package streamit with following code before environment initialization:
# Import package streamit
from maro.streamit import streamit
# Initialize environment and send basic information of experiment to database.
env = Env(scenario="cim", topology="global_trade.22p_l0.1",
         start_tick=0, durations=100)

for ep in range(EPISODE_NUMBER):
      # Send experimental data to database by episode.
      streamit.episode(ep)
To get the complete reference, please view the file maro/examples/hello_world/cim/hello.py.
After starting the experiment, user needs to query its name in local database to make sure the experimental data is sent successfully.
Start service
To start the front-end and back-end service, user need to specify the experiment name. User could specify the port by adding the parameter “front_end_port” as following command:
maro inspector geo --start service --experiment_name YOUR_EXPERIMENT_NAME --front_end_port 8080
The program will automatically determine whether to use real-time mode or local mode according to the data status of the current experiment.
Feature List
For the convenience of users, Env-geographic tool implemented some features so that users can freely view experimental data.
Real-time mode and local mode
Local mode
In this mode, user could comprehend the experimental data through the geographic information and the charts on both sides. By clicking the play button in the lower left corner of the page, user could view the dynamic changes of the data in the selected time window. By hovering on geographic items and charts, more detailed information could be displayed.
The chart on the right side of the page shows the changes in the data over a period of time from the perspectives of overall, port, and vessel.

The chart on the left side of the page shows the ranking of the carrying capacity of each port and the change in carrying capacity between ports in the entire time window.
Real-time mode
The feature of real-time mode is not much different from that of local mode. The particularity of real-time mode lies in the data. The automatic playback speed of the progress bar in the front-end page is often close to the speed of the experimental data. So user could not select the time window freely in this mode.
Besides, user could change the mode by clicking. If user choose to view the local data under real-time mode, the experimental data generated so far could be displayed.
Geographic data display
In the map on the page, user can view the specific status of different resource holders at various times. Users can further understand a specific area by zooming the map. Among them, the three different status of the port: Surplus, Deficit and Balance represent the quantitative relationship between the empty container volume and the received order volume of the corresponding port at that time.
Data chart display
The ranking table on the right side of the page shows the throughput of routes and ports over a period of time. While the heat-map shows the throughput between ports over a period of time. User can hover to specific elements to view data information.
The chart on the left shows the order volume and empty container information of each port and each vessel. User can view the data of different resource holders by switching options.
In addition, user can zoom the chart to display information more clearly.

Time window selection
This feature is only valid in local mode. User can select the starting point position by sliding to select the left starting point of the time window, and view the specific data at different time.
In addition, the user can freely choose the end of the time window. When the user plays this tool, it will loop in the time window selected by the user.